case Study
The Platform
Creating Operational Visibility in a Rapidly Scaling IoT Platform
-
The company was growing from a startup into one of Europe’s largest residential Virtual Power Plants. The complexity of the platform was growing faster than its operational visibility.
Hundreds of thousands of connected devices interacted with cloud infrastructure, mobile applications, and energy market services. The organisation was expanding rapidly, engineering teams were shipping new capabilities, and customer adoption continued to accelerate.
Understanding what was happening across the platform remained very challenging for us, often taking hours to understand if the behaviour was abnormal.
Due to this uncertainty environment, customer complaints were often treated as platform-wide incidents. Investigations relied heavily on Slack conversations, fragmented logs, and individual troubleshooting expertise. Different teams had visibility into different parts of the system, but no shared understanding of how the platform behaved as a whole.
Our challenge wasn’t a lack of data, it was a lack of visibility. It became obvious very early, without a clear view of system behaviour, diagnosing issues will be inevitably slow, and operational decisions relied more on assumptions than evidence. As the platform was getting ready for significant growth, this way of operating was becoming unsustainable.
It was clear to me - operational visibility needs to come first.
-
The solution was not a dashboard. It was the visualisation of the complete operational picture.
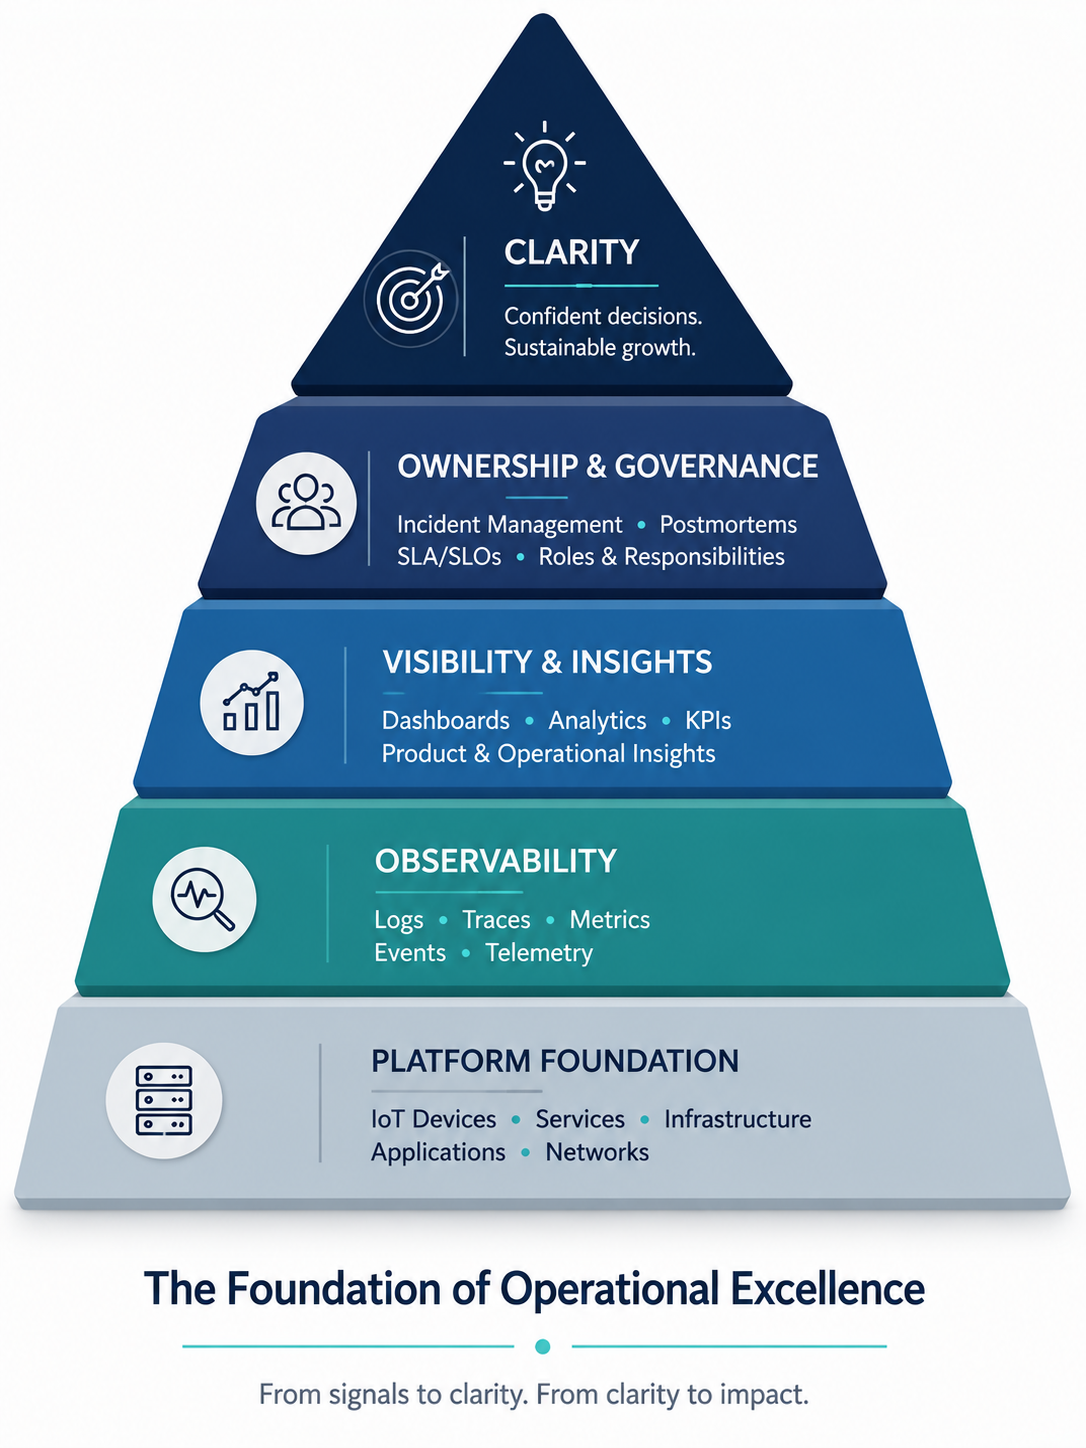
A platform-wide observability capability needed to be stablished, bringing together backend services, frontend applications, infrastructure components, IoT devices and vendor solutions into a common monitoring framework. Logs, traces, telemetry, and operational events became accessible through a shared view of platform behaviour.
Alongside technical observability, a second layer of visibility was needed to provide the full picture. Observability is great for performance monitoring and troubleshooting but it doesn’t collect product usage or feature adoption out of the box. This layer of analytics was implemented separately.
Observability
Backend logs, distributed traces and error tracking.
Frontend logs, distributed traces and error tracking.
Infrastructure logs, and metrics.
IoT device logs, telemetry and health monitoring
Operational dashboards collecting patterns and knows issues
Anomaly dashboards
Product & Operational Analytics
Product usage and adoption
Feature performance monitoring
Installation quality metrics
Device health indicators
Configuration drift analysis
Customer behaviour insights
Leadership performance reporting
For the first time, product teams, engineering teams, operations, customer success, and leadership were working from the same reality and for the first time, platform behaviour became visible end-to-end.
-
As visibility improved, a second problem became obvious.
Many incidents were no longer difficult to identify, but the organisation lacked a consistent way to respond to them.
Visibility alone does not improve reliability. Ownership does.
A structured incident management framework was introduced to ensure that issues could be consistently identified, owned, resolved, and prevented in future.
Incident Management
Incident severity definitions
Ownership models
Escalation paths
Service level expectations
Operational runbooks: what to do when - automated.
Structured postmortems
The implementation took effort, as every change does. And the challenge wasn’t the design of a process, it required influencing stakeholders, and keeping resilient and focused on the overall goal. But it paid off, the organisation gradually evolved from a reactive approach into an synchronised process.
-
Later analysis revealed that a large proportion of incidents originated from software changes and releases.
This insight shifted the focus from reacting to failures toward preventing them.
It became obvious, only at this point, the organisation release process wasn’t resilient enough.
Release Governance
Risk assessments before development began
Release readiness reviews
Deployment validation checklists
Rollback and mitigation planning
Post-release monitoring
Reliability became embedded earlier in the development lifecycle rather than addressed only after failures occurred.
You may not believe it, but developers loved these additional steps in the process. This approach gave them the time to think about potential risks and how to mitigate them, without a incident ongoing and users complaining at the same time.
-
Over time, the platform transformed from a system that generated data into a system that generated understanding.
Issues that previously required hours of investigation became diagnosable within minutes. Ownership became clearer. Teams collaborated more effectively. Incident frequency decreased, recovery times improved, and customer satisfaction increased.
Results
Incident resolution time reduced from 4 hours to 1 h
Improved root-cause identification across 55 micro-services
Reduced incident frequency through release governance
Increased customer satisfaction by 25%
Greater leadership confidence in platform reliability
Scalable operational foundations supporting continued growth
Most importantly, platform reliability became a managed process rather than a reactive activity.
The lasting outcome was not the observability tooling itself.It was the creation of a shared operational language that allowed the organisation to understand, operate, and scale an increasingly complex platform with confidence.